

Dashboard
Ageing Well Dashboard
This Dashboard provides fast access to data analysis of the factors identified as important indicators for, or measures of the health and well-being of older people living in Milton Keynes City. It features data and charts accompanied by explanatory text that highlights the most important trends and data points. The data is accurate as of April 2025.
Format: This is a Power BI dashboard, which enables you to interrogate the data and charts according to your needs. See instructions below for how to get started.
How to use the Dashboard
This Dashboard is delivered in an interactive Power BI version that will enable you to interrogate the data and charts specifically to your needs. You can:
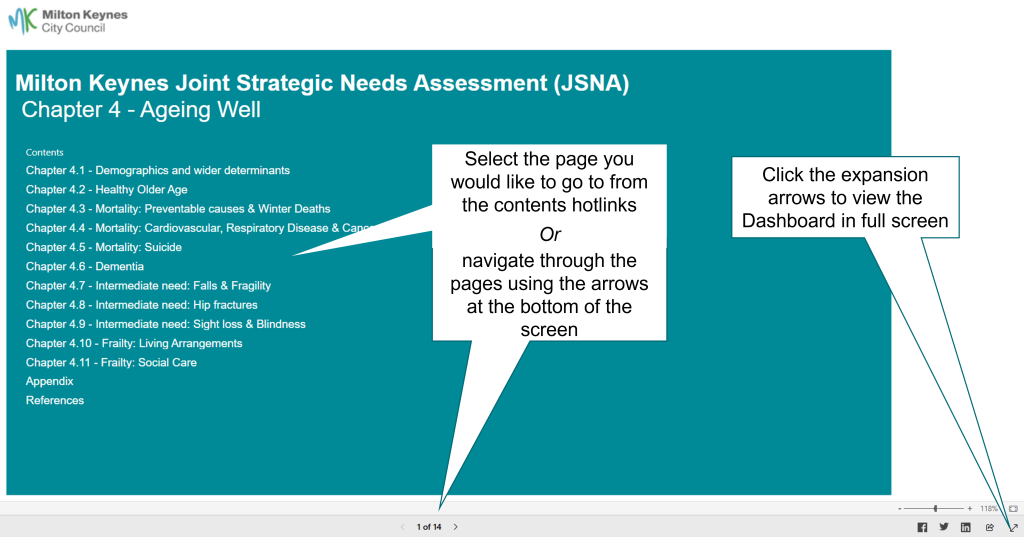
- Navigate around the pages in the Dashboard by clicking on the contents hotlinks or the page number at the bottom of the screen, which reveals the page menu or by clicking on the arrows
- Display the Dashboard in full screen mode by clicking the expansion arrows in the bottom right corner
Use of comparators: For all the data presented in this Dashboard, comparators are provided to add context to the values shown for Milton Keynes City. In all cases an overall average for England is shown and, wherever possible, values for the Deprivation Decile are also provided. This allows for comparison with other local authorities with similar levels of deprivation. If data is not available for the Deprivation Decile, Regional values are shown instead.
Please note: The National and Council data reflect the 2021 Census. Ward level data from the 2021 Census is not yet available and therefore these profiles use the 2011 Census estimates. Therefore the sum of wards does not equal the Milton Keynes City total. These profiles will be updated as and when the data becomes available.
Interrogate nationally available data
Most of the data featured in the Dashboard are available through Fingertips, the Public Health data tool provided by the Office for Health Improvement & Disparities. Each link will take you to the trend data for Milton Keynes City for that indicator. You can then chose what other views you would like including by comparator areas and inequalities. (Please note: The areas covered by Milton Keynes City are referred to as Milton Keynes in Fingertips). For more information on how to use Fingertips, see the user guide.
Population demographics and projections
Disability free life expectancy at birth (male)
Disability free life expectancy at birth (female)
Disability-free life expectancy at 65 (male)
Disability-free life expectancy at 65 (female)
Health related quality of life for older people (age 65+)
Health promotion factors
Population vaccination coverage: Flu (aged 65 and over)
Population vaccination coverage: Shingles vaccination coverage (71 years)
Mortality rate by cause
Under 75 mortality rate from causes considered preventable (Male)
Under 75 mortality rate from causes considered preventable (Female)
Under 75 mortality rate from all cardiovascular diseases
Mortality rate from all cardiovascular disease, ages 65+ years
Percentage of deaths with underlying cause circulatory disease (all ages)
Under 75 mortality rate from respiratory disease
Mortality rate from respiratory disease, ages 65+ years
Mortality rate from cancer, ages 65+ years
Percentage of deaths with underlying cause cancer (all ages, ages under 65, 65-74, 75-84 and 85+)
Direct standardised rate of mortality: People with dementia (aged 65 years and over)
Indicators of intermediate need
Emergency hospital admissions for hip fracture in persons 65 years and over
Emergency hospital admissions due to falls in people aged 65 and over, 65-74, 75-84 and 85+
Hip fractures in people aged 65 and over, 65-79, 80+
Osteoporosis: QOF prevalence (age 50+)
People aged registered blind or partially sighted (65-74, 75+)
Preventable sight loss – age related macular degeneration (AMD) (age 65+) (England only)
Mental disorders and dementia
Estimated prevalence of common mental disorders: % of population aged 65 & over
Dementia: Recorded prevalence (aged 65 years and over)
Estimated dementia diagnosis rate (aged 65 years and over)
Dementia: Direct standardised rate of emergency admissions (aged 65 years and over)
Social Isolation and care
Percentage of adult carers who have as much social contact as they would like (aged 65+)
Permanent admissions to residential and nursing care homes per 100,000 aged 65